

Rose AI
AI-assisted data discovery,analysis and visualization,particularly for financial research;verify sources and confirm access and cost with the vendor.

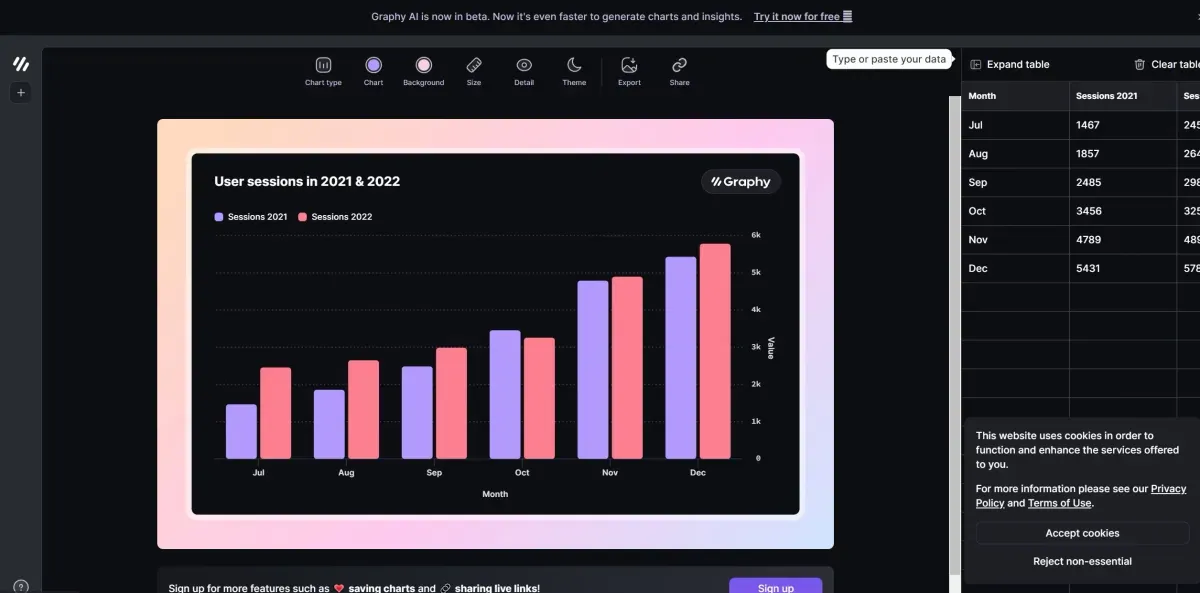
Graphy creates interactive charts and data stories from supported files and tables. A limited free plan and paid options are available; check data, axes and sharing settings before publication.
Graphy creates interactive charts and shareable data stories. Supported starting points include CSV, Excel, Google Sheets and entered values, with AI assistance for preparing visualisations and analysis.
Clean column names and units and define the question. Choose a chart suited to comparison or change over time, then inspect axes, aggregation and missing values. Attractive graphics can mislead when periods or sample sizes differ.
Include the period, measure and source in the title or notes, and verify conclusions against the data. Review link permissions for internal information and freshness when a source updates. An AI summary does not establish causation or forecasting accuracy.
Free access limits charts and AI use. Paid plans add options such as watermark removal, custom colours, refresh or advanced sharing. The connected graphy.dev platform offers an SDK and developer interfaces; check its licensing and pricing separately from the web app subscription.
AI-assisted data discovery,analysis and visualization,particularly for financial research;verify sources and confirm access and cost with the vendor.

OSSInsight is a free platform for analysing public GitHub activity and comparing projects. Data Explorer is under maintenance and some rankings are paused; check time coverage before comparing results.

Arcwise helps teams investigate metric changes and prepare data-linked explanations or reports. Review definitions and context, and confirm current access, pricing and integrations rather than relying on older spreadsheet-extension descriptions.